How to View Your Costs, Usage and Savings?
How to Add Your Cost per kWh
Click on “System Settings” found in the side bar.
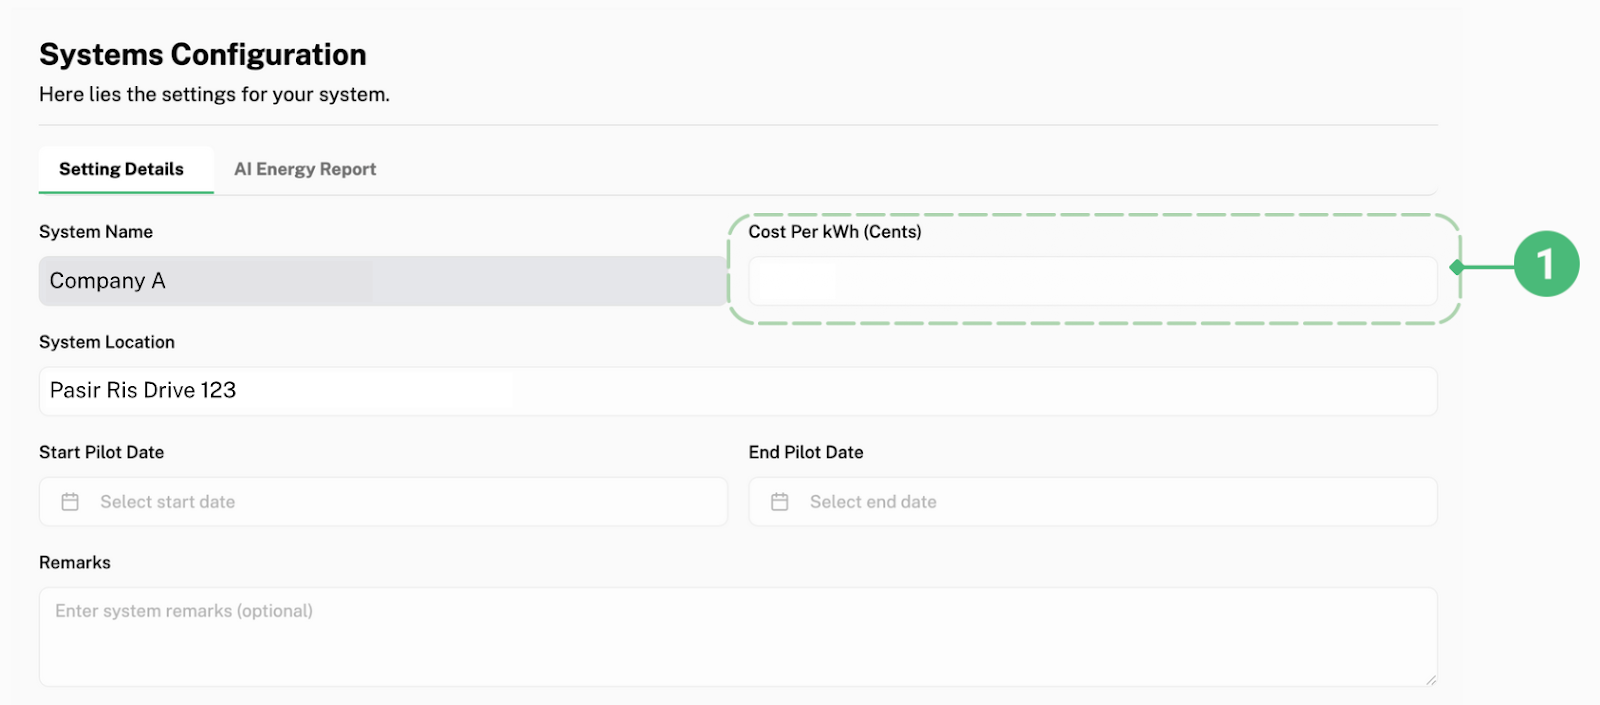
This is the page that will be displayed on your screen:
Scroll to the bottom of the page and click on “Edit Form”.

Next, click on “Cost Per kWh (Cents)” labelled as 1. Referring to your monthly utility bill from your utility provider, find the cost per kWh you are currently paying for your company’s energy usage and fill in this number under 1.
Scroll to the bottom of the page and click “Save Changes” to save this number into your System Configuration.

You are able to view the amount of money and energy saved from saving energy by looking and comparing the graphs found under “Energy Usage Breakdown Over Days”. Savings can be viewed for each plug, room, user, tenant (one of your company’s branches), or overall system (all of your company’s branches).
The “Energy Usage Breakdown Over Days” can be viewed in the Plug/Room/User/Tenant/System Dashboard.
How to View Energy Usage Breakdown Over Days for Your Plug/Room/User/Tenant
To access the Plug/Room/User/Tenant Dashboard, first click on their respective names in the side bar.
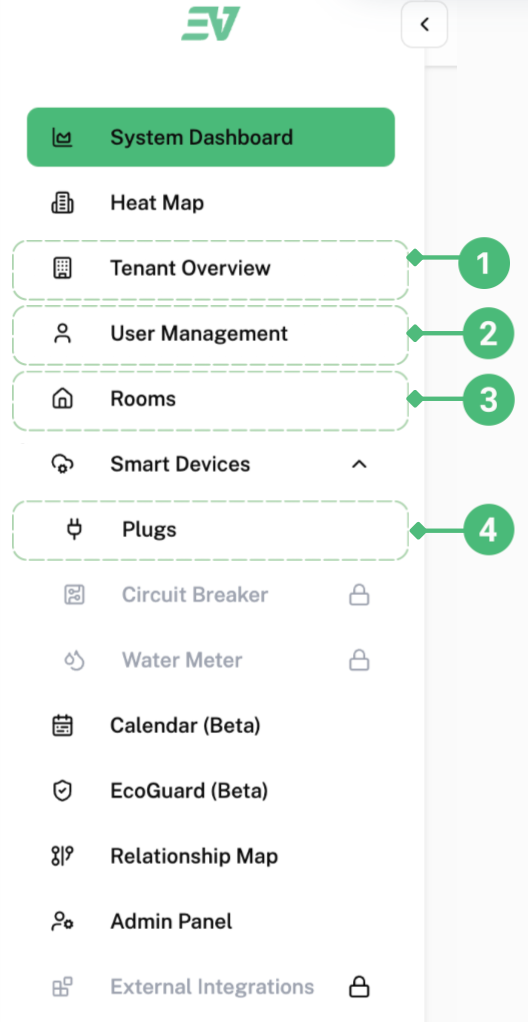
Click on 1 to access the Tenant Table
Click on 2 to access the User Table
Click on 3 to access the Rooms Table
Click on 4 to access the Plugs Table
Then, to access the Tenant (1) / User (2) / Rooms (3) / Plugs (4) Dashboard, in the table, click on the ID (found in blue as shown below, “cec” is just an example of how the ID looks like in the table) of the Tenant (1) / User (2) / Rooms (3) / Plugs (4) you want to check the savings of.

Then, scroll until you see the “System Energy Usage Breakdown Over Days” Graph.
How to View Energy Usage Breakdown Over Days for Your System
Using the overall system as an example,
Click “System Dashboard” found in the side bar:
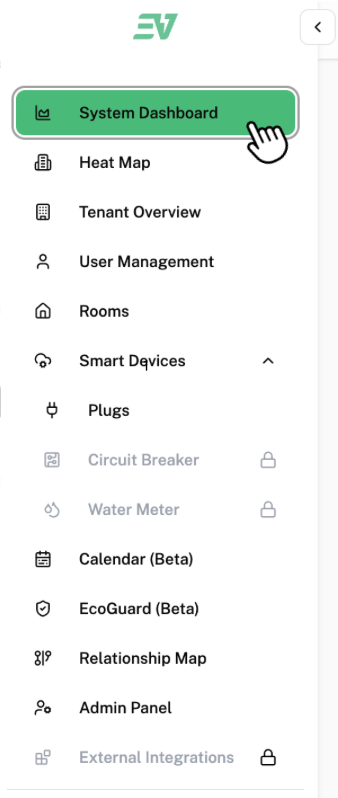
This is the page that will displayed on your screen:
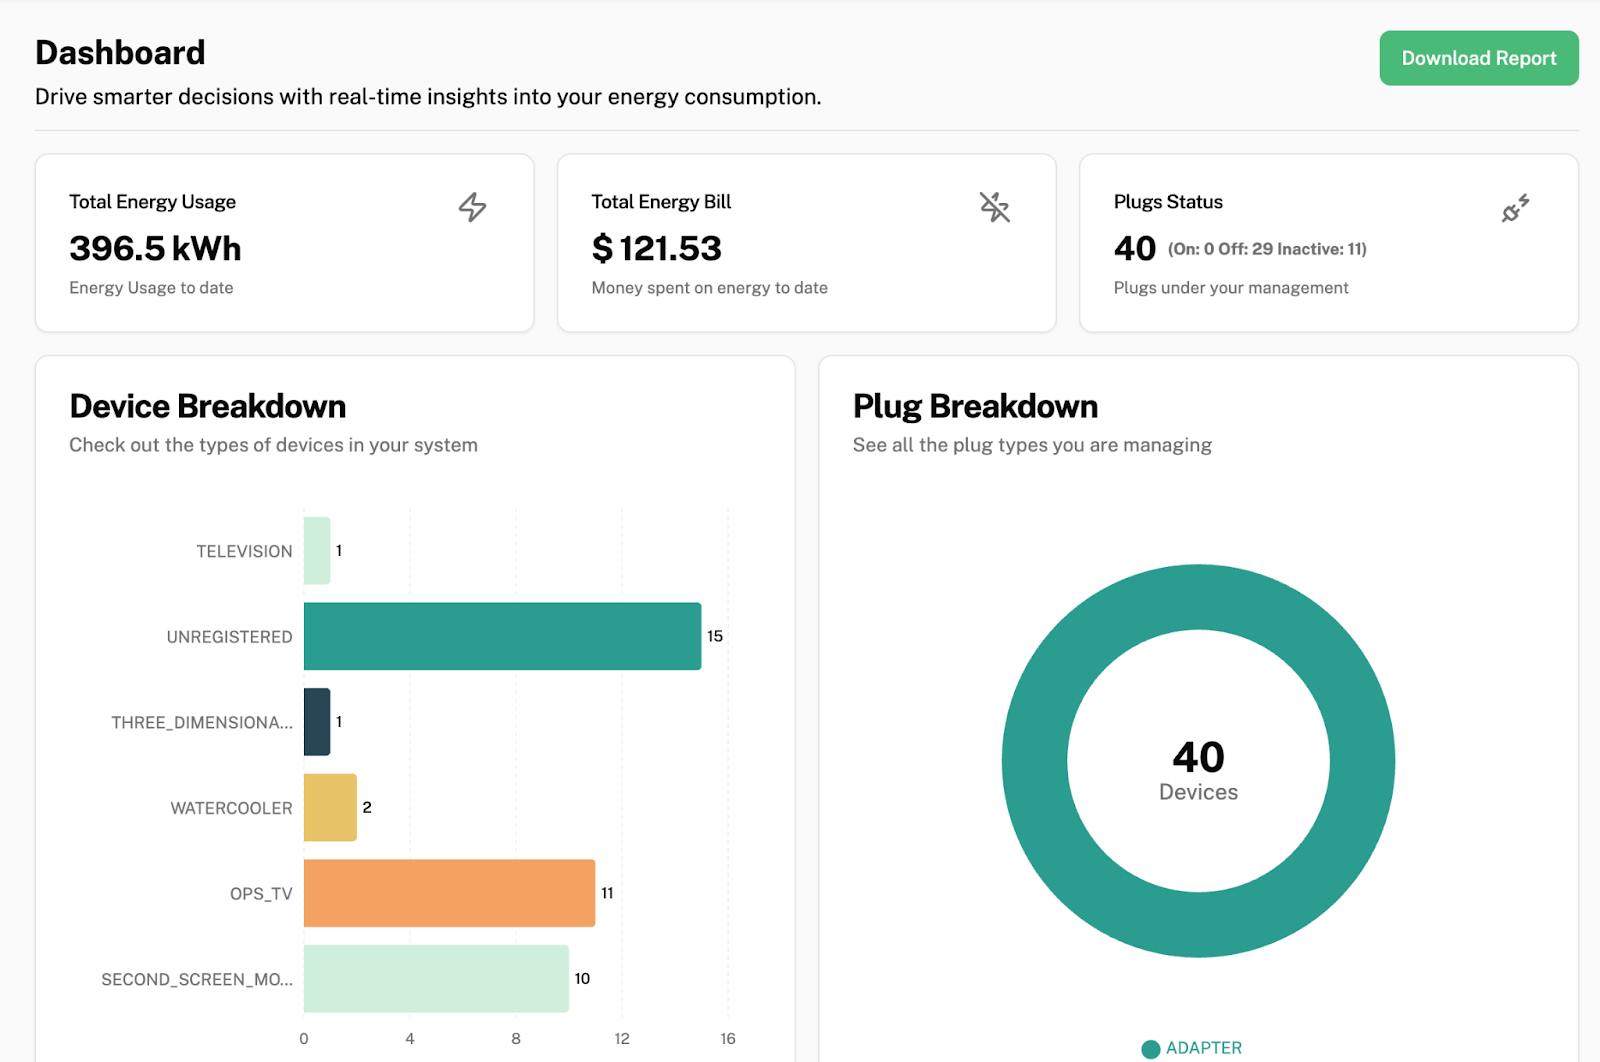
The System Dashboard shows you all the information across all of your company’s branches.
How to View How Much Money and Energy Has Been Saved
Scroll down until you see “Energy Usage Breakdown Over Days”.
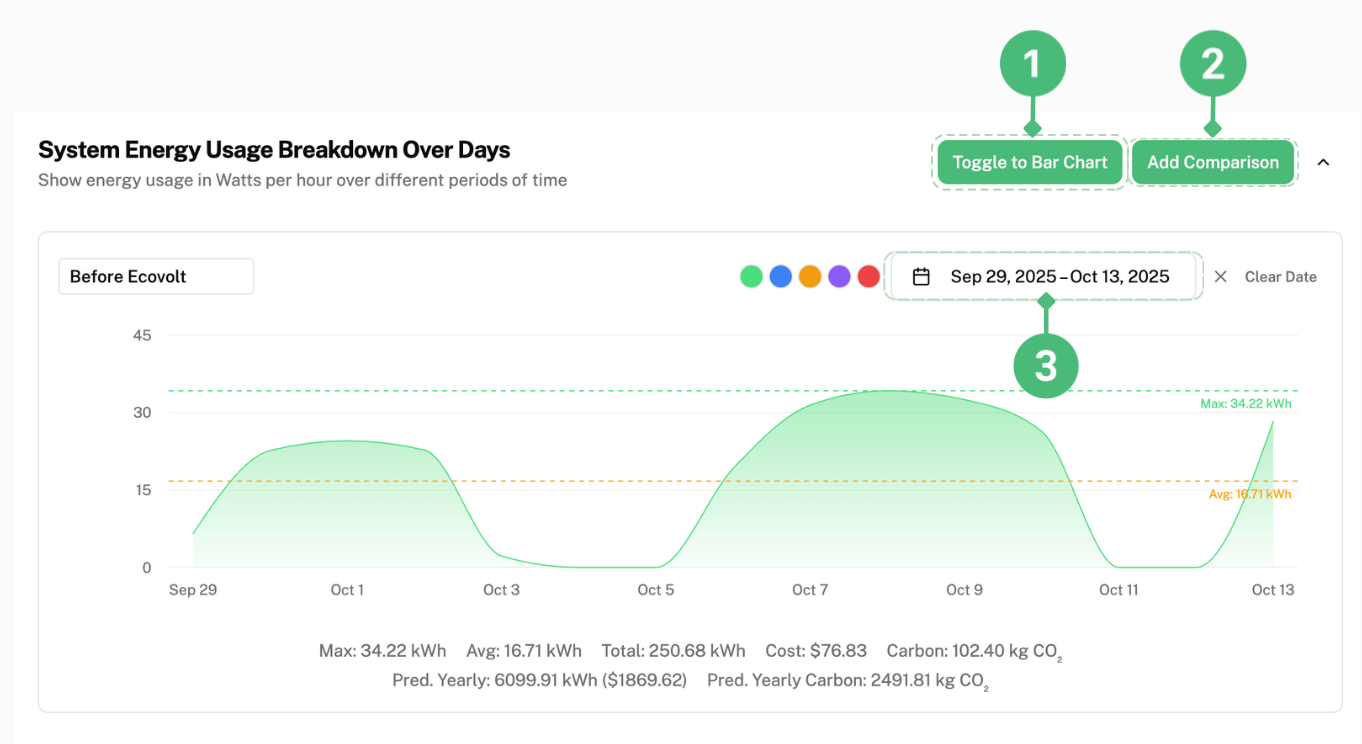
If you prefer to view the energy usage as a bar graph, click “Toggle to Bar Chart” labelled as 1.
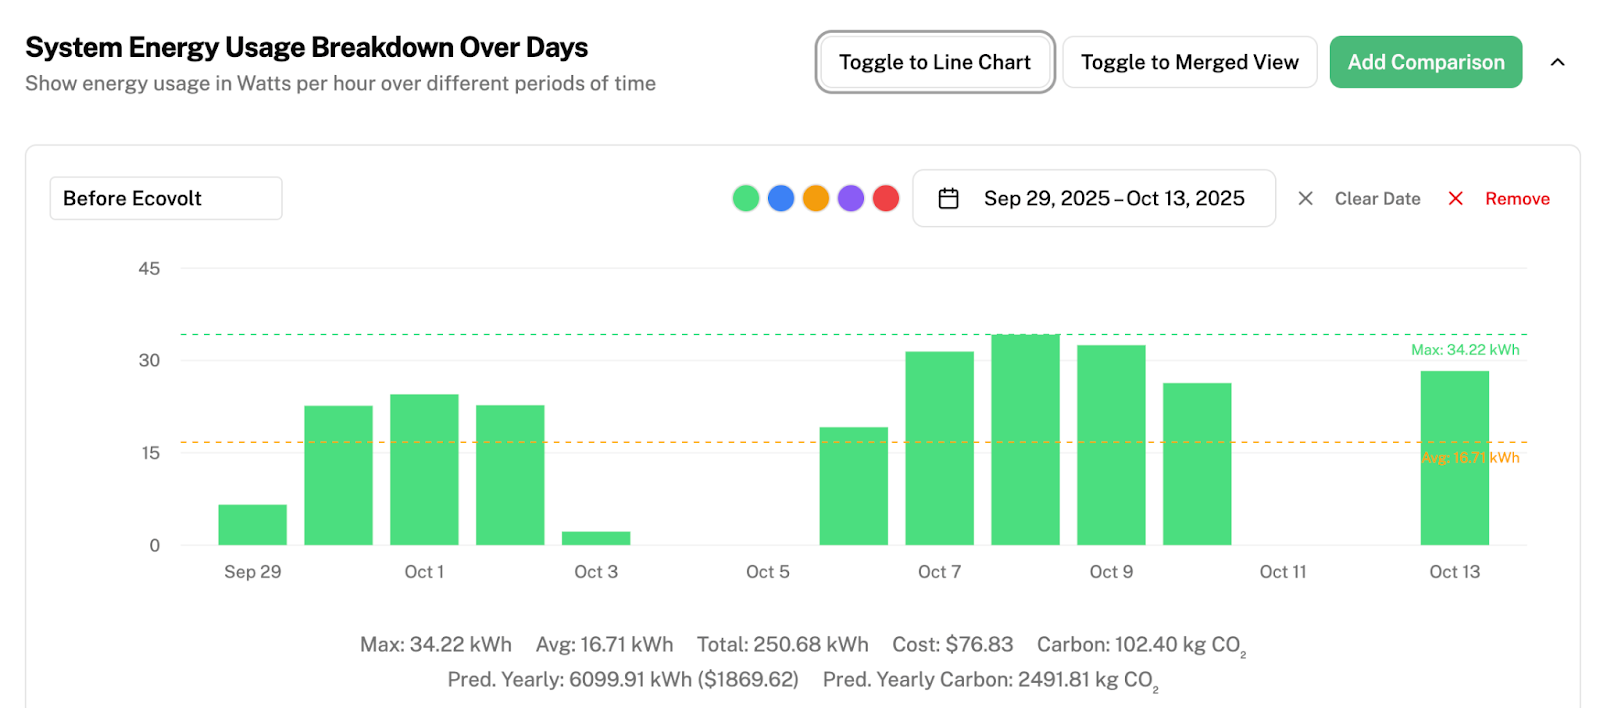
The graph will be changed as seen below:
To choose the dates you want to view the system energy usage breakdown of, click on the button labelled as 3.
This is the pop-up that will be displayed on your screen:
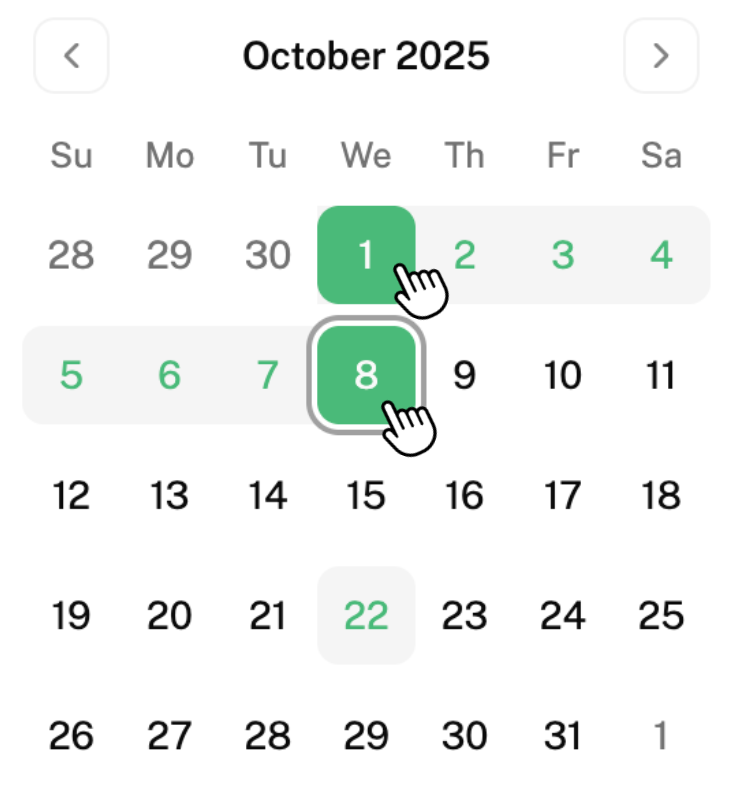
For example, to pick the date range 1–8 October, first click on “1”, then click on “8”. The days 1–8 October will be selected as shown on the left.
To unselect, click on the first number you selected once, in this case it would be “1”.
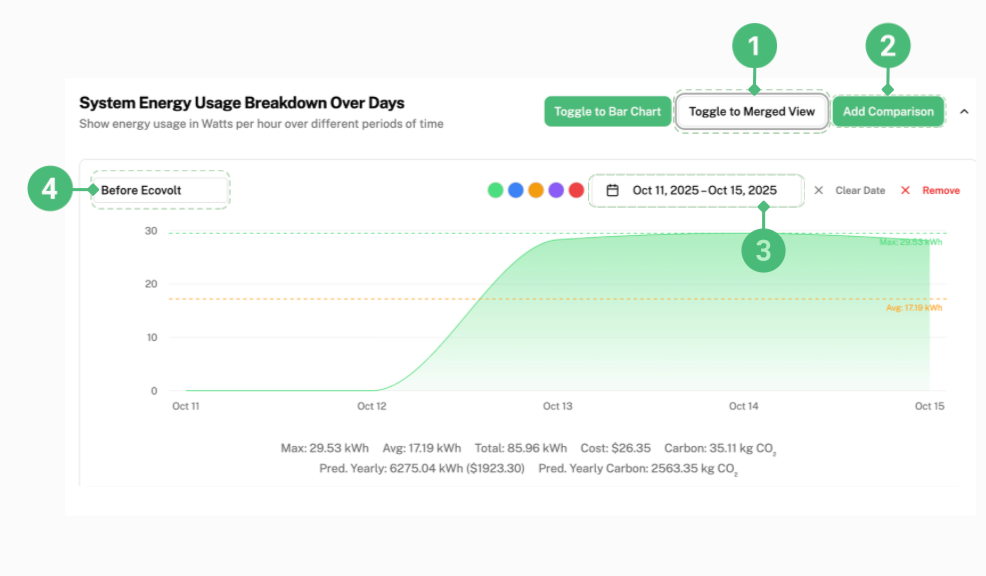
To view how much money was saved from saving energy, you have to first add a comparison graph. To add a comparison graph, click on “Add Comparison” labelled as 2.
A graph like the one shown below will appear below your first graph.

Next, for easier comparison, you should label your two graphs. This can be done by clicking the button labelled as 4 and filling in the title you wish to name your graph.
For example, if you would like to see how much energy and money was saved after switching to Ecovolt Smart Plugs, you can label the first graph “Before Ecovolt” and the second graph “After Ecovolt”.
For a better visualisation of how much energy you are saving, you can merge the two graphs by clicking “Toggle to Merged View”. You should select a consistent time period for both graphs for a better comparison (e.g. choosing a Monday–Friday time interval for both “Before Ecovolt” and “After Ecovolt”).

The graphs will merge as shown below:
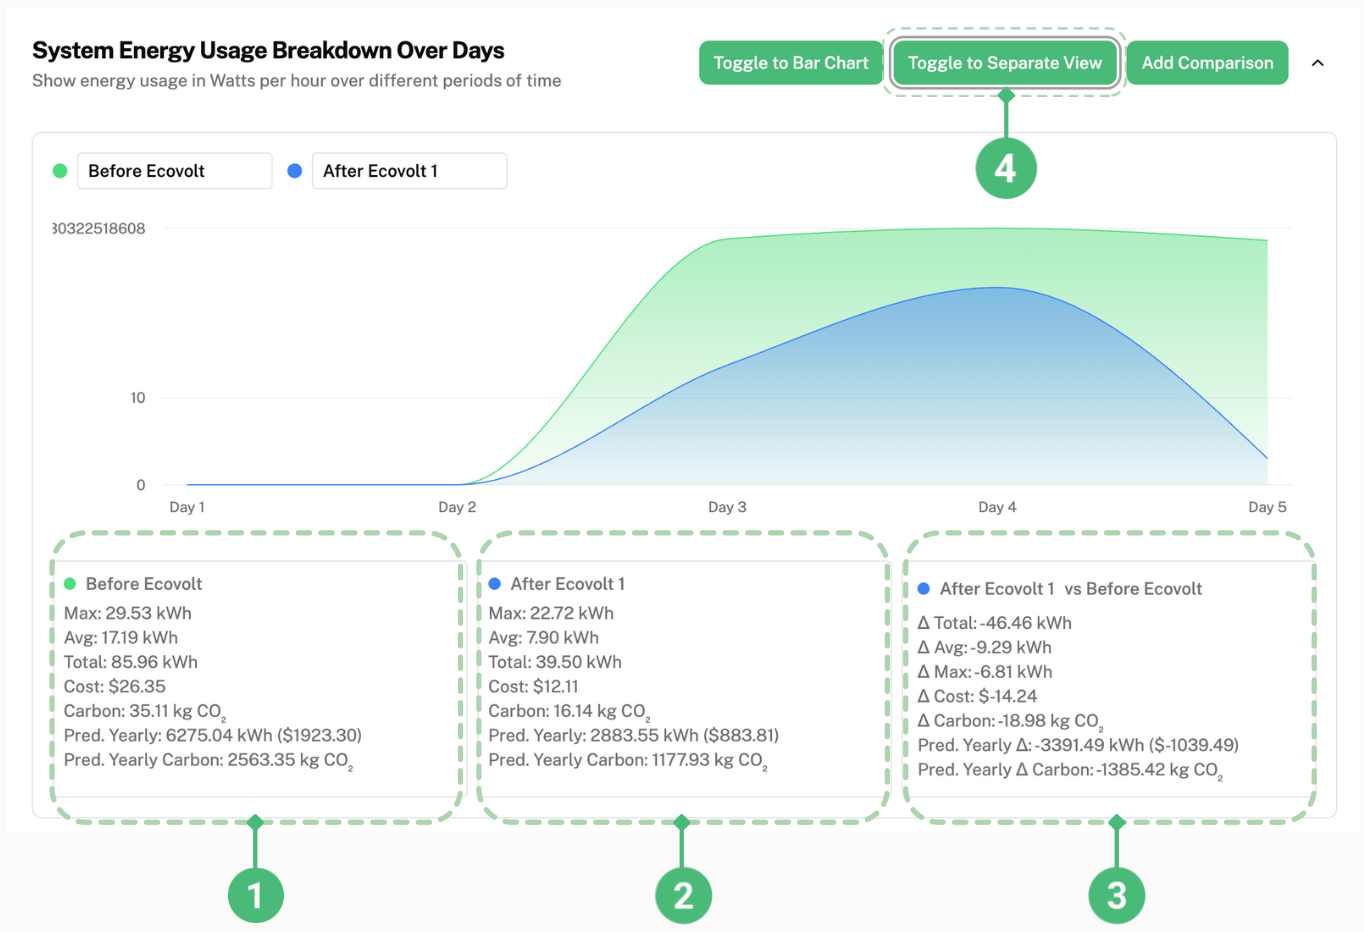
The section labelled as 1 shows you all the information of energy usage, carbon and costs of your entire system (all branches of your company) in the time period you have selected. (In this case, before your company started using Ecovolt Smart Plugs). It also provides the predicted yearly energy usage and cost based on these numbers.
The section labelled as 2 shows you all the information of energy usage, carbon and costs of your entire system (all branches of your company) in the time period you have selected. (In this case, after your company started using Ecovolt Smart Plugs). It also provides the predicted yearly energy usage and cost based on these numbers.
The section labelled as 3 shows how much energy and costs you have saved as well as how much less carbon has been emitted (in this case, these savings and cuts are due to switching to Ecovolt Smart Plugs).
For example, referring to 3, “Cost: $-14.24” shows that you have saved $14.25 in this time period.
“Pred. Yearly” shows that you are predicted to save 3391.49 kWh in energy and $1039.49 per year with your current plug schedule.
How to Adjust Your Plug Schedule to Save More Energy and Costs
If you are satisfied with the amount of energy and money you are saving, and wish to schedule the plugs so that they are turned on for a shorter period of time, thereby saving more energy, follow the steps below:
Click on “Calendar (Beta)” found in the side bar.
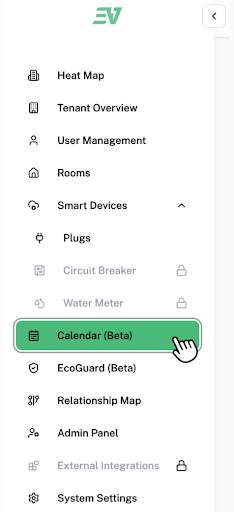
This is the page that will be displayed on your screen:
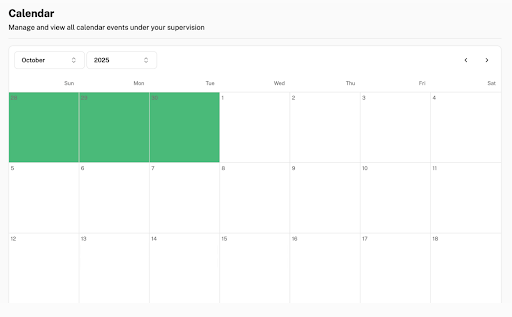
To add a schedule for a specific date, click on the box of the date you want to add a schedule to.
This is the pop-up that will be displayed on your screen:
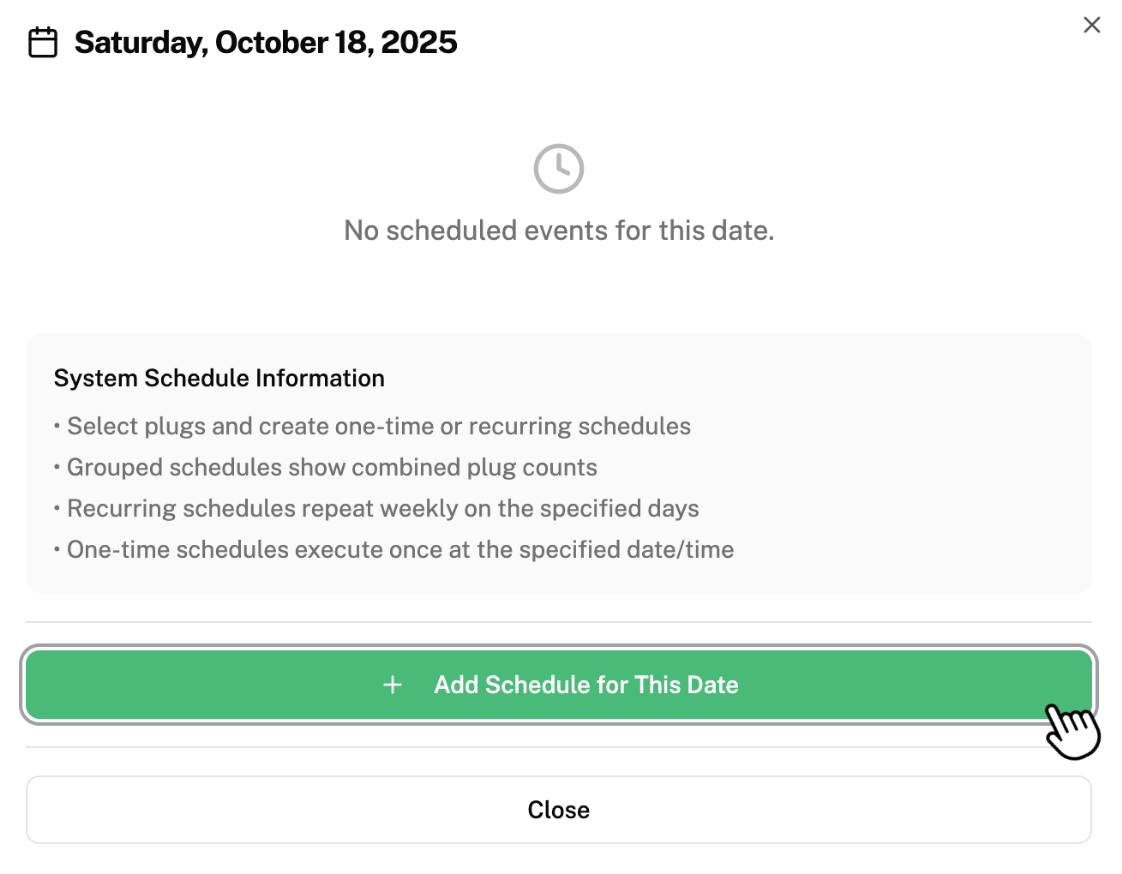
Click on “Add Schedule for This Date”.
This is the pop-up that will be displayed on your screen:
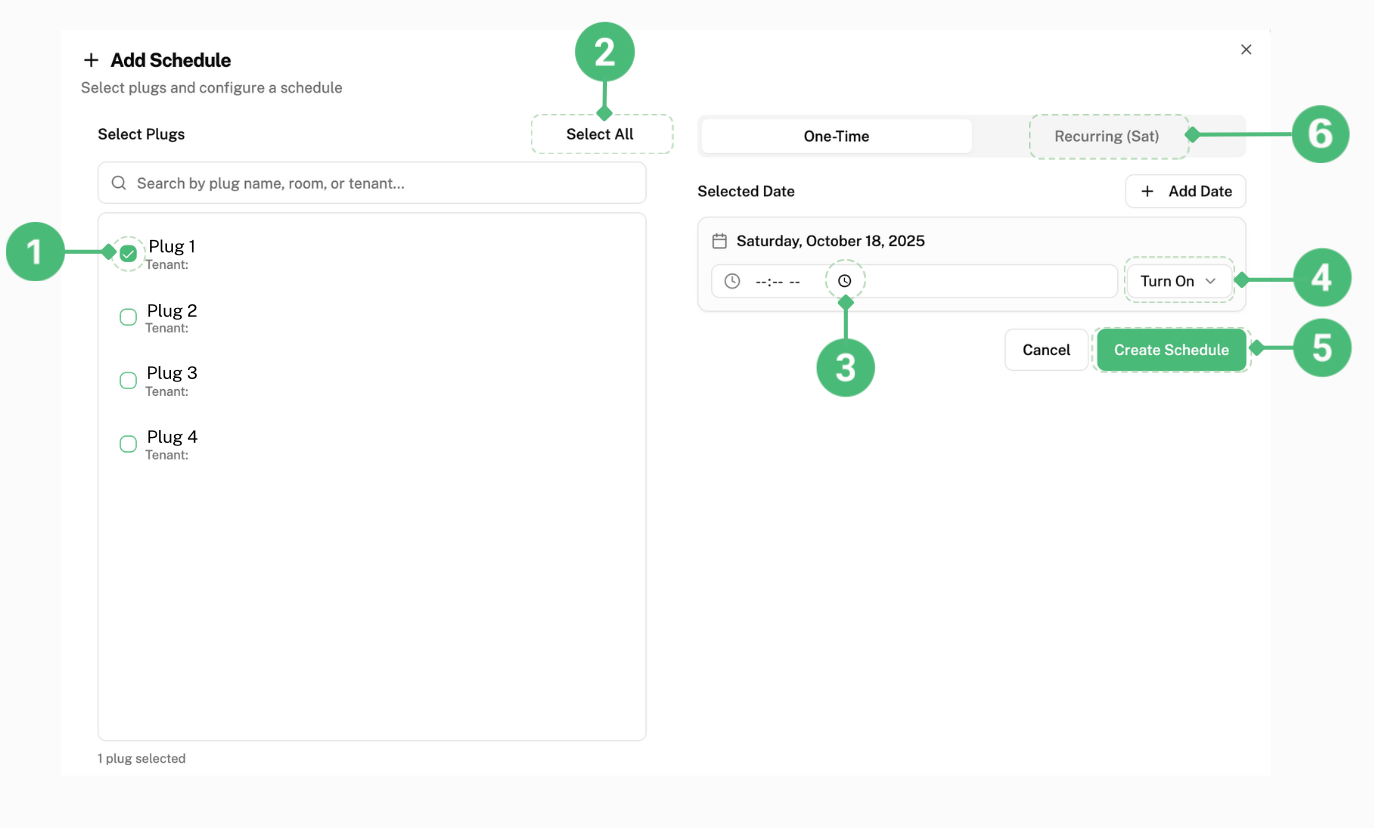
To individually select the plug you want to set a schedule on this date, click the small box next to it labelled as 1.
To set a schedule for all the plugs in your system on this date, click on “Select All” labelled as 2.
To set a time, click on the clock symbol labelled as 3.
This pop-up will be displayed:
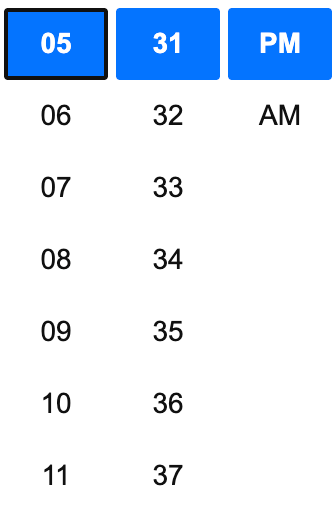
Select the time you want your plug(s) to turn on or off.
Click on “Turn On” labelled as 4 and select whether you want your plug(s) to turn off or on for the time you have set.
Click on “Create Schedule” labelled as 5 to save this schedule in your system.
Multiple schedules can be added on the same day.
To add a schedule that recurs every week, click “Recurring” labelled as 6 and repeat the same steps as mentioned above.
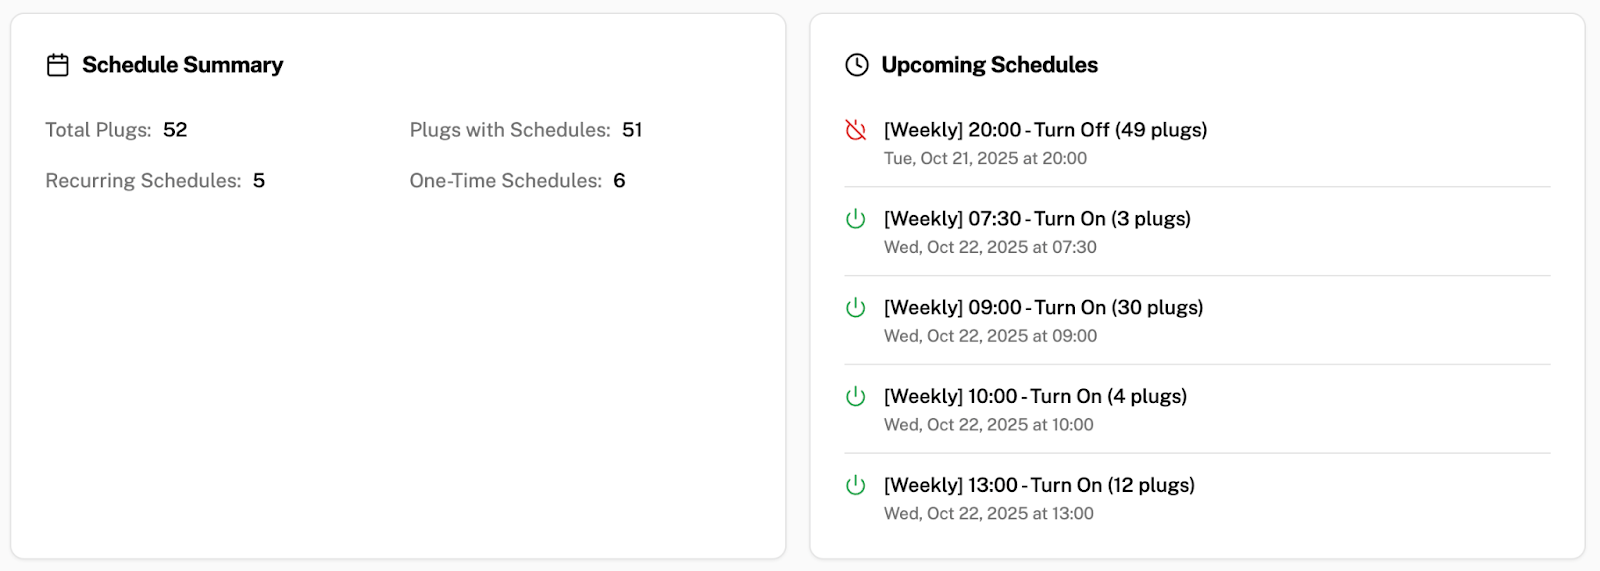
To get a summary of all the schedules you set, scroll to the bottom of the page. This is an example of what you will see:
How to optimise your energy and cost savings
To further optimise your energy savings and thus lowering costs, we recommend changing the plugs schedule in two-week intervals.
For example, after discovering that in the first two weeks (e.g. 10–24 Oct) of using Ecovolt Smart Plugs and setting a scheduled timer for the plugs, you are saving energy and money, you should change the scheduled timer for the plugs (shortening the time period the plugs are turned on for) and keep them at this new schedule for two weeks (e.g. 24 Oct – 7 Nov).
Then, pick a consistent one-week time frame (e.g. a Friday to a Friday) from each of these two time intervals to compare “System Energy Usage Breakdown Over Days” line graphs (in this case, the consistent time intervals used to compare will be 10–17 Oct and 24–31 Oct).
This way, you can see how effective changing the schedule of the plugs is in saving energy and thus money.